


A growing number of organizations are investing in advanced technologies to empower their business intelligence programs. There’s an industry-wide shift in the way we understand and utilize data today, and data visualization tools have a lot to do with it. Advanced data visualization tools offer a suite of sophisticated features along with data analytics capabilities, with Power BI among the most powerful tools available in the market. Power BI is enabling organizations to make time-sensitive decisions by providing actionable insights from enterprise data in a short time.
With Power BI, you can generate interactive visuals in reports and dashboards to understand relationships between parameters, capture the latest trends, and track projects or campaigns. One of the best practices to follow while using Power BI is to undertake some level of performance tuning for your reports. You may do this for a variety of reasons like Power BI received updated new features and you want to assess/enhance performance, or you encountered performance issues and want to identify bottlenecks.
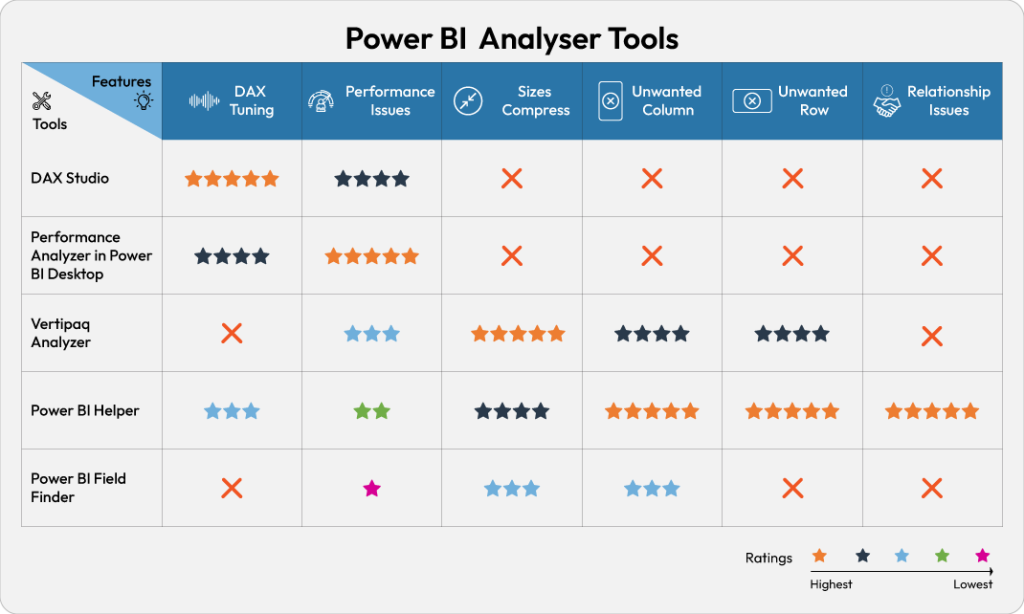
There are tons of built-in features and open-source tools available to optimize the performance of your Power BI reports – to name a few:
DAX Studio
This tool writes, executes, and analyzes DAX queries in Power BI Designer, Power Pivot for Excel, and Analysis Services Tabular. Analyzing DAX queries can be helpful to understand the performance issues and to improve the writing of DAX queries. DAX Studio includes object browser, query editing and execution, formula and measure editing, syntax highlighting and formatting, integrated tracing, and query execution breakdown. Some of the features:
- Internally uses daxformatter.com, which allows users to keep DAX measures or columns formatted, making code easy to read
- Easily swaps the delimiter style for DAX expressions
- Integration with VertiPaq Analyzer 2.0 (preview feature)
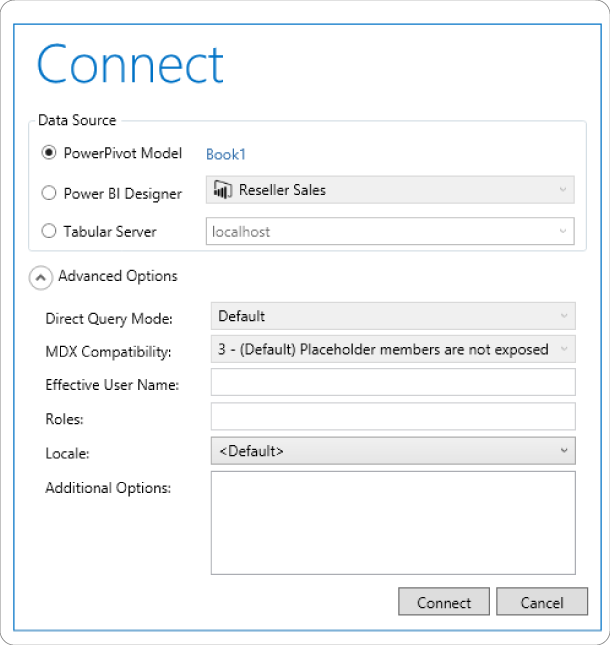
- Connects with a variety of data sources (Fig. 1)
- Only calculates the time taken by the DAX query to generate results on Power BI; does not consider time required for loading visual and network processing.
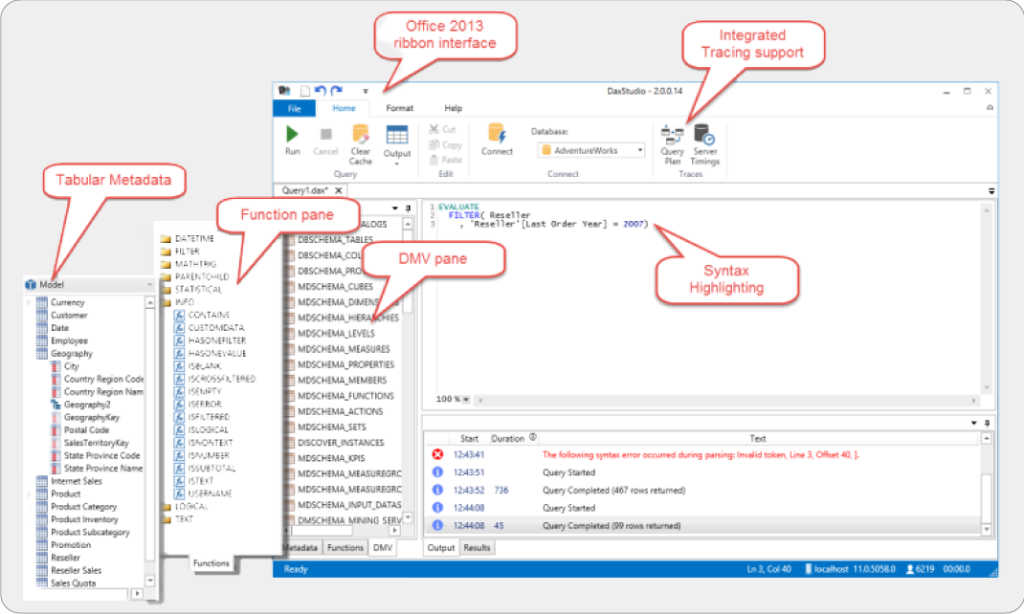
One of the popular features is ‘Load Perf Data’ which allows DAX studio to import the JSON file from Power BI Performance Analyzer. Once the PowerBIPerformanceData.JSON file is imported, the PBI Performance pane in DAX displays all the queries captured by the Power BI Performance Analyzer. Figure 2 displays various components in the DAX Studio.
Performance Analyzer in Power BI Desktop
Performance Analyzer evaluates and displays the duration required for updating or refreshing Power BI visuals, helping the user identify which visual or element is impacting the performance of the report. Some of the features of Performance Analyzer are:
- Capability to record the user actions and log time for each activity which allows users find the bottleneck
- Collect and display real-time information related to performance
- Captures the duration time in milliseconds for each visual on the page which helps tune the performance of the report
- Each visual’s log information comprises of the duration to complete the following types of tasks: DAX query, visual display, and more
- Allows for saving the performance analyzer list generated by the tool in the JSON format using the ‘export’ option; compare operations after completing multiple required actions
Vertipaq Engine
Vertipaq Engine stores the data column-wise as opposed to the row-wise data storage in SQL databases. It uses internal algorithms to avoid duplicates in the columns which reduces the size of data and time to query. Some of the features include:
- Insights into queries, columns, and the size of the relationships which enables the user to document the model; analyzing the size of the table and columns is an important step in optimizing the data model for Power Pivot, Power BI, or Analysis Services Tabular
- Show the cardinality of columns in the table which helps identify areas in the model that take up space
- Provides a hierarchy list of all columns and size of the rows
- Provides many ‘dynamic management views’ to collect information about the memory used by a data model
Power BI Helper
Power BI Helper is a free tool available to the Power BI community to develop and enhance the performance of Power BI reports. It can help you to find all the details about DAX measures and all the expressions with syntax errors. Some capabilities:
- Allows hiding of tables from report view that are not used in any of the visuals
- Gives directional filters, inactive relationships, and modeling advice
- Shows list of tables and bookmarks, where the tables are being used, and if there are any filters used; also provides information on the measures that are not working
- Allows exporting data in the CSV file format regardless of the row count
- Provides information about all service objects like apps, gateways, data sources, and service configurations
Power BI Field Finder
This tool can be used alongside DAX Studio and Power BI Helper to draw a complete picture of your model and the report. However, it shows the areas where fields are used only in the visuals and filters, not in the relationships or measures. As a result, exercise caution before deleting any columns or measures, especially if your model is being used in other reports.
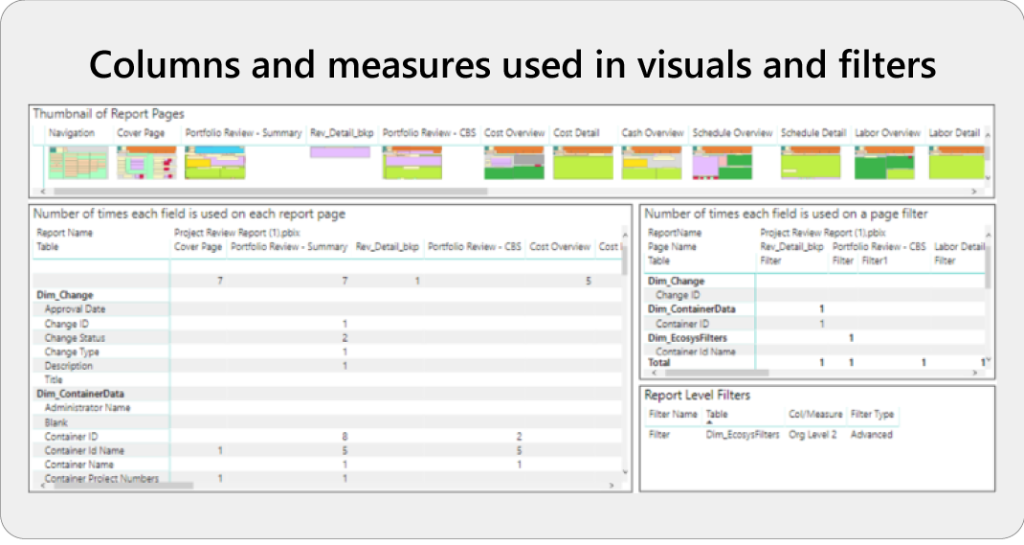
A typical report generated by Power BI Field Finder (Figure 3) consists of multiple tabs where each tab gives results related to columns, measures, and page details. It shows you how often each column or measure is used on each page. You can investigate each column from the table to see each visual on the page and even take your investigation further to check out where the columns and measures are used in sections of the visual.
Using Power BI Analyzer Tools
Bottlenecks that lead to slow performance are difficult to find for professionals generating Power BI reports. It’s especially difficult to find the exact area of the bottleneck that requires attention.
Designing reports isn’t the simplest part of using Power BI – there are multiple factors that affect optimal performance that need to be investigated. But with tools like Vertipaq Engine, DAX Studio, and more, users can more easily identify the source of performance issues at a more granular level.
Which of these tools do you want to explore or have more questions about?
Let us know or connect with one of our experts if you’ve got any more questions!
Want to read more Power BI and Digital Transformation content? Check out CloudMoyo’s resources here >>
Originally Published 03/27/2020, Updated 02/11/2023
By Vishnuvardhan N, Analytics team CloudMoyo
