


COVID-19 has hit the world hard—and businesses across sectors are among the most effected ones. From delays in supply deliveries to a less-optimal work environment, critical business revenue is at the end of the day vulnerable. Organizations like architecture, engineering, and construction (AEC) customers of CloudMoyo confronted the reality that in these critical times, obtaining the insights and agility to pivot and prioritize was more important than ever.
Organizations like architecture, engineering, and construction (AEC) customers of CloudMoyo confronted the reality that in these critical times, obtaining the insights and agility to pivot and prioritize was more important than ever.
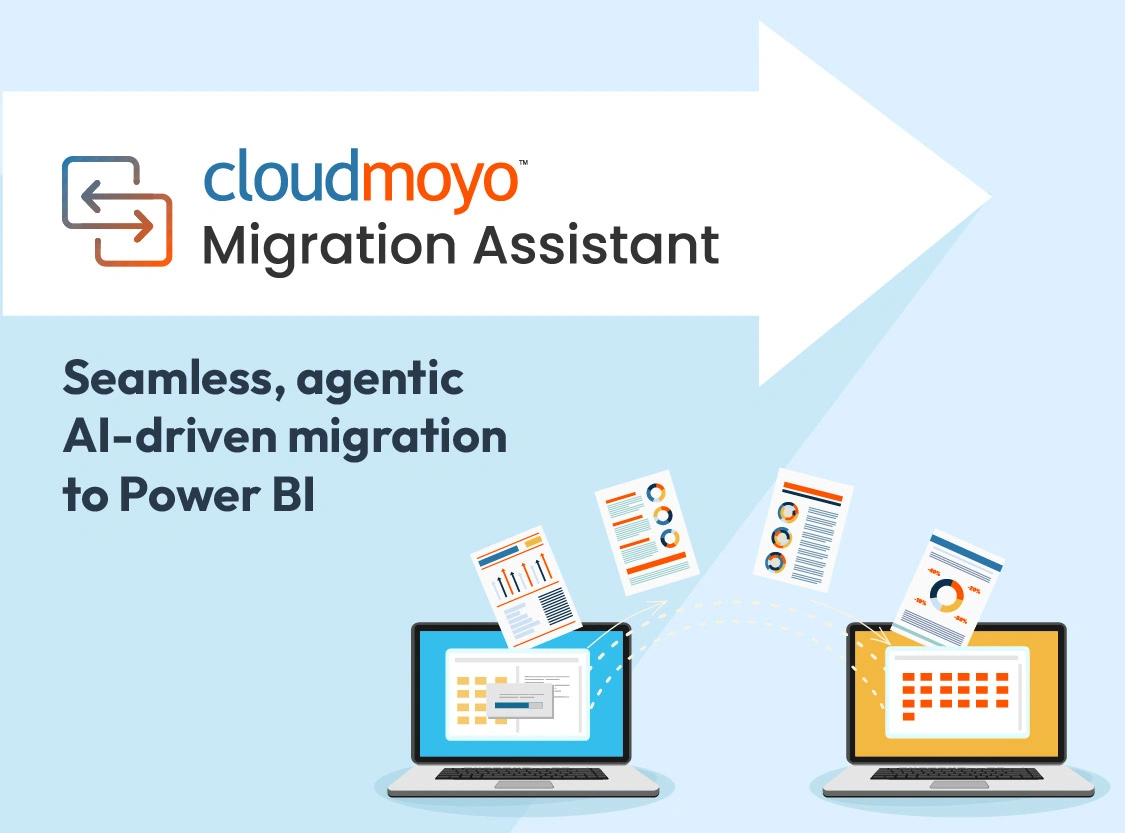
This is where enhanced decision analytics enters the picture, empowering businesses to create and share interactive dashboards that allow business users to filter, sort, and visualize data independently, and make smarter business decisions to ensure the future health of the organization.
In this webinar, analytics experts Sanket Saraph and Sujeet Singh shared insights and tools that you can apply in your own organization, including how to gain a single view of even the most complex data to prepare for analysis and data visualization in business intelligence (BI) tools like Microsoft Power BI.
What else you’ll learn in the on-demand webinar:
- The global impact of COVID-19 on businesses
- Building a roadmap to a digital future with decision analytics
- How we partnered with an AEC company to unlock critical insights to pivot and prioritize
- Q&A with our speakers
In this on-demand webinar, you’ll get a behind-the-scenes look at a solution you can apply in your organization, especially during a crisis situation like the Covid-19 pandemic. The walk-through of the interactive Power BI dashboard with what-if parameters will include:
- Implementation of what-if parameter in an existing model and Power BI reports
- Intuitive and interactive view of financial data around project status and backlog sourced from Oracle and ERP
- Change parameters such as interest rates and reporting period to enable near-future projections
- View a bifurcation of business revenue by tracking corresponding impacts on the project backlog trend by month
In a future of unknows, data stands apart as a source of clarity and insights that can help your organization stay on top of project timelines, mitigate workforce disruptions, and avoid negative impacts on business revenue.
