


By Sagar Katte, Snehal Kumbhar, and Suraj Kumbhar from Analytics team, CloudMoyo
Consider an example where the Power BI report is using Azure Analysis Services (AAS) cube in the back end. When a high number of user connections are created using VSTS load testing, it is a good practice to analyze what is happening to the system in the background. Monitoring the logs can help us analyze system usage and help make informed decisions about scaling up or down. This can be achieved by monitoring each of your system logs.
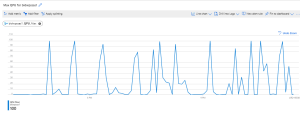
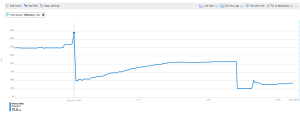
Azure AAS Metric QPU usage log
Analysis Services provides metrics in Azure Metrics Explorer such as to monitor memory and CPU usage, number of client connections, and query resource consumption which helps to monitor and investigate the performance whether the production server can work good with high no. of user connections in real-time. Further, the metric – query pool job queue length, increases when the number of queries in the query thread pool queue exceeds available QPU and this would eventually impact the performance of the server. If the QPU is getting maxed out during load testing, it means that the number of queries against your model is exceeding the QPU limit for your plan.
For example, in image 1, QPU usage is 100. The given AAS instance is having S1 pricing tier and it comes with 100 QPU and 25GB of memory capacity. With the given number of user connections, QPU is getting maxed out. It means that there is a CPU bottleneck and it is very likely that queries are queuing up waiting for available resources to execute.
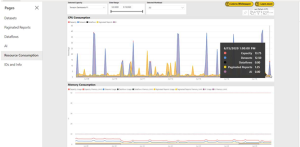
Also, the memory consumption graph (image 2) shows a maximum 16 GB utilization of 25 GB.
This determines whether scaling out for the server is necessary or not. If QPU usage is getting maxed out, then scaling up for the server is advisable. Scale-up decisions can be taken when your model is redesigned in an optimal way. Redesigning the model would save resources and make it unnecessary to scale up.
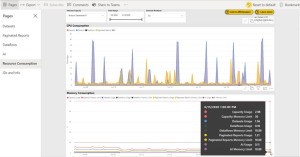
Power BI premium Capacity log
It gives many insights on capacity performance. There are six different pages going from a global overview on ‘Resource consumption’ to more specific details in ‘Datasets’. Let’s take a quick look:
- Datasets: Metrics about datasets. Information about refreshes, queries, and possible bottlenecks.
- Paginated reports: Usage and runtime of paginated reports.
- Dataflows: Amount, duration, and resource consumption of data refreshes.
- AI: Usage and resource consumption of AI components
- Resource consumption: Global overview of CPU and memory consumption.
- IDs and info: Metadata about capacities, workspaces, datasets, paginated reports, and dataflows
To monitor any noticeable drop in the performance during load testing, the ‘Resource consumption’ section will help to investigate whether the issue is memory related or CPU related and which of the Power BI components is causing it. The tab is split into two visuals – CPU usage and other memory consumption. It can give a fair indication if the workload limit is constrained.
With these metrics, you can make more informed decisions and truly manage/upgrade your premium capacities, workspaces, datasets, and workloads.
SQL Profiler
You can also leverage the SQL profiler tool to trace activities and operations executed on an analysis service or any database engine to be analyzed later. SQL Profiler tracks engine process events such as the start of a batch or a transaction. It captures data about those events, enabling you to monitor server and database activity like user queries or login activity. SQL Server Profiler is responsible for two main operations:
- Tracing: It can monitor all operations executed over an instance
- Replay: It can rerun all operations logged in a trace later
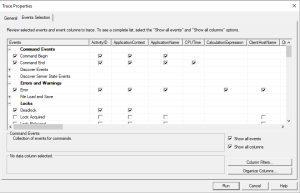
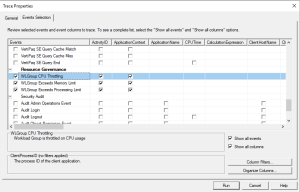
Login to the Azure Analysis Service Database and select SQL Server Profiler. Create a ‘Trace’ by providing Trace Name. You can also provide the time frame for traces to keep running during load testing. Click on ‘Events Selection’ tab and select the events which are useful for debugging and analysis purpose. In image 5, the selected events are related to dead-locks and resource group governance to identify if CPU usage or memory utilization is exceeding.
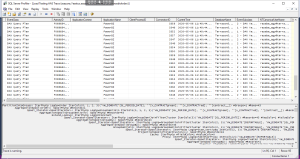
The image shown below explains the DAX query plan execution and the time taken to generate data. We can analyze those queries which are taking more time and plan to optimize them. Further, we can identify the queries and the time at which CPU utilization is getting throttled. If the CPU/memory utilization is throttling at an observed point of time, then it is advisable to check how many users are loaded in VSTS load testing at that time. In such a scenario, we can revisit the capacity or optimize DAX in order to improve performance.
List of issues faced during load testing
Http 401 Error: Unauthorized error. You need to add AUTH token
Http 403 Error: Forbidden. AUTH token has expired and you need to replace it per request
Https 405 Error: Method not allowed. This error occurs when a wrong method is added in the request. To solve this, you need to check and use the proper method in the request
Https 429 Error: Too many requests. Add ‘Think time’ for resolving this error
Power BI gateway shutdown: When the number of users loaded is more than the maximum capacity of the Power BI report, then Power BI gateway service may become unavailable.
Last but not the least, let’s take a quick look at the pricing:
![]()
VUMs = (max virtual user load for your test run) * (test run duration in minutes)
Some of the advantages of using this method are:
- Load testing is embedded in the Visual Studio which makes it a much more powerful tool than others. It has access to core VS features meant for developers such as line by line debugging, breakpoints, source control, collaboration, saving results to SQL, connections to various databases, writing custom code, including external libraries, Nu get packages, creating extensions, customizing scenarios, management of cookies, sessions, and more.
- Virtual user licenses such as JMeter and VS Load Tests don’t charge extra for virtual user licenses or protocols. You are free to simulate as many users as your on-premises hardware supports.
- Scaling is supported and easy to use and setup. You can install agent software on the load generation machines and a controller software to coordinate it all. Alternatively, you can leverage an easy to use integrated cloud load generation feature.
- It has seamless integration with the Microsoft Application Lifecycle Management (ALM) tool stack: Azure and VSTS. Reporting, results, requirements tracking, and builds can easily be managed in VSTS. Strong integration with VSTS for source control and agile planning is also supported
- Load testing can be carried out directly via VSTS, Azure or even uploading the VS Load test.
- It has a good monitoring and analysis feature that overlaps and compares metrics from any Windows machine to which it has access. You get any metric that is accessible to perform.
- It has a simple enough Integrated Development Environment (IDE) that makes it easier to visualize scripts (web tests) in a declarative way, make edits to it, and perform correlations and extractions in the IDE without doing any scripting. Recording works well and the autocorrelations for supported applications like SharePoint make your life much easier.
- For more complex scenarios, programming skills are needed but the Visual Studio IDE makes it easier when compared to other alternatives. The IDE also makes it easier to create load test scenarios, manage connections to the test rig or cloud load generation.
- You have access to a well-documented knowledge base in the form of Microsoft Developer Network (MSDN).
- There is no extra cost for the load testing feature. The existing Visual-Studio enterprise license or MSDN subscription is all you need to get started. Your current on-prem hardware can be used for scaling the load, this helps to simulate as many v-users as you need.
Some of the challenges associated with the use of VSTS are:
- Most companies don’t want to invest in the Visual Studio Enterprise license for the testing team. Also, the fact that it is not a standalone tool makes it a bit of an obscure feature that gets lost among the many features of Visual Studio. Given how it’s not very well known in the market, accounts for the low market share.
- Currently, only the Http/web protocol is supported. Visual Studio, being a development platform can easily accommodate testing other protocols like database, FTP, SOAP, and even desktop and unit testing. This is because VS load tests can take the unit tests and codedUI class objects. For this, however, you would need programming skills and know what you are doing.
- The support is limited, as it is Windows only, recording can only be done on IE, and it supports scripting with C# language only.
- Reporting is limited. VS load tests generate excel reports for trends and comparisons, but these reports are not better than those of the Load Runner.
Wrapping up
Power BI report performance and load testing can be done using Visual Studio Enterprise Edition with an Azure DevOps account. Load testing determines the overall performance of the report and helps to analyze how much user load the Power BI report can handle.
