By Sagar Katte, Snehal Kumbhar, and Suraj Kumbhar from Analytics team, CloudMoyo
Microsoft was named a leader in Gartner 2020 Magic Quadrant for Analytics and BI Platforms and Power BI played a major role here, as it’s a powerful tool that keeps getting better with regular updates. Power BI enables you to transform data into powerful insights with intuitive visualization features. It helps you create meaningful dashboards, collaborate with teams across departments, share insights, and access your reports from anywhere, whenever you need.
As Power BI reports are gaining immense popularity, we thought of getting our experts to give you the best tips for the smooth implementation of reports and handling of load during peak times. You will also get a sneak peek into our unique method of safeguarding clients’ reports against an extreme load.
Load testing using VSTS
Let’s take a look at the prerequisites for Visual Studio Team Services (VSTS) load testing for Power BI, and the detailed steps of implementing load testing within your organization. We will also dive into the pros and cons of this method.
The feature has been included by Microsoft in every release of Visual Studio since 2005. Its core features were updated in 2008 and 2012, since then most updates have been focused on cloud load generation, testing with VSTS, its integration with Azure and VSTS for DevOps, and continuous release scenarios.
Steps to perform web testing and load testing
1) Create a web performance and load test project in Visual studio to start a Test plan for load testing. The next step will be to create a new project in Visual Studio and name it appropriately.
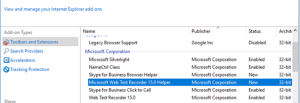
2) To begin the load testing, record the web performance test. There are a few prerequisites to it such as enabling the “Web Test Recorder 15.0” on IE Browser, installing the TLS plugin in Visual Studio 2017, and the Microsoft Web Test Recorder 15.0 Helper (shown in image 2).
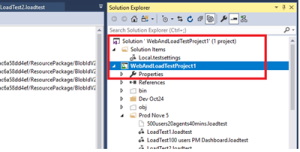
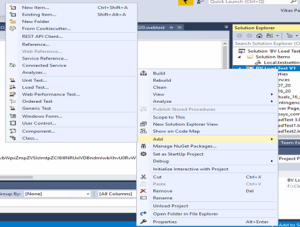
- Right click on your project and add the Web Performance Test (as shown in image 3). You will be navigated to Internet Explorer (Visual studio support IE browser) where you can add the url: app.powerbi.com
- Before you get started with the Power BI report page/workspace/report, there will be a lot of unwanted HTTP request getting recorded. You can delete all those requests by clicking the delete button before you navigate to the required report page. You can add comments like ‘Power report Page Name’ to identify different Power BI report pages. Wait till Power BI report page is fully loaded and all the requests for that page are recorded, then you can add a comment as next page name then goes to the Next page. Click on the stop button, once all Power BI report requests are recorded.
Now, it navigates to the Visual Studio, which looks for dynamic parameters for the HTTP responses to each of your HTTP requests. A progress bar appears while this happens. If the dynamic parameters are found, a table will appear. You can assign constant values to each dynamic parameter. Save the test.
- You can identify tests according to the Power BI report page based on your comments to get different Power BI report pages for load testing and even page-level load testing results. Try to run the web tests and check if it passes.
3) Load testing can be done in two environments: On-Premises load testing where organizations use the existing performance lab and a limited number of user load; and cloud-based load testing where a performance lab is created in the cloud to generate high user load from Azure data center
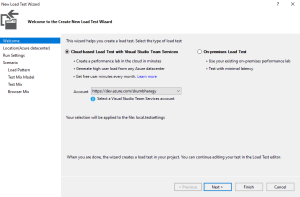
- Right click on your project and add web performance testou will be redirected to a new load test Wizard as shown in image 4 below.
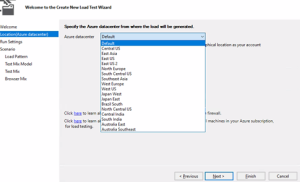
For cloud-based load testing, you will need an Azure DevOps account to login and connect to VSTS. Select the location where your application is hosted. For example, if your Azure data center is hosted in the Eastern US region, then you’ll have to specify the same region for accurate testing results (shown in image 5).
- For on-premises load testing, there isn’t a need for an Azure DevOps account and to specify a location. Simply add load test duration in run setting and select Think Time profile for Power BI report load testing as a scenario. In case you want to know more about ‘Think time’: It is the time that a real user waits for between actions. With no Think Time, the webserver will get hit with many requests. If the server is under greater load, the response time will suffer.
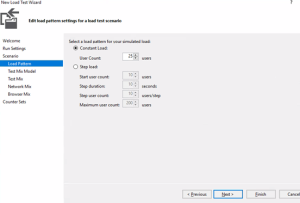
- For selecting load pattern in on-premises load testing, if test run uses 25 or more virtual users per core, then VUMs is calculated as (max virtual user load for your test run) * (test run duration in minutes), as shown in image 6.
- Select the test mix model and add the web tests that you have recorded earlier. Add the appropriate network mix that you are using. In the browser mix, select the browser you are using. Once you finish the wizard, a web performance test is added to the load test and appears in the load test editor. Now, you can run the load test.
How load testing result is helpful in optimizing the performance
1) Default generated report:
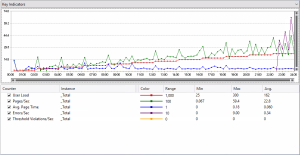
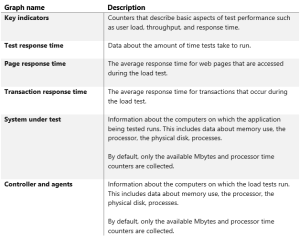
The following table lists the default generated reports that are available to analyze load test results.
2) Customize Report:
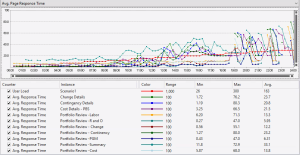
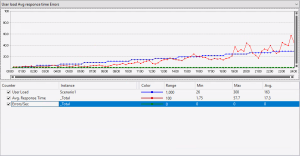
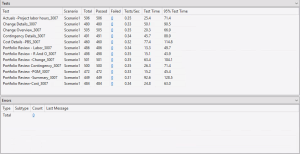
In the customized report, we can add or contribute all the content from the default report with multiple combinations of results. You can also include the form factor of individual and overall details. Custom specific metrics can be used such as total users, the average response time (average time to download a request including think time) of the transaction, total errors, average test time (time is taken to execute all requests within a web test and think times), and average page time (average time to download the page and all of its dependent excluding the think time).
Avg. Page Response Time:
User Load Avg response time errors:
Test logs:


