


How to print an entire Power BI report content with a single click
As a data visualization tool, Power BI provides rich visualization, self-service functionalities, as well as the ability to embed Power BI reports into your organization’s applications—a feature that helps organizations to securely embed dashboards into an application in order to provide seamless integration in a cost–effective way.
Today, Power BI has limitations when it comes to the printing of the entire report content. The tool only allows you to print the visuals and the data currently shown on the screen while skipping or ignoring the content which is hidden behind the table scrollbar.
This forces many organizations to use either SQL Server Reporting Services (SSRS), or paginated reports in Power BI Premium. However, both these options have multiple limitations.
To solve this common challenge, CloudMoyo has developed a customizable module that can be plugged into your application to support all your Power BI reports printing needs.
In this blog post, we’ll explore how we can print the entire embedded Power BI report with the help of the custom, CloudMoyo module. For the purpose of this blog post, we’ve used Java (Spring MVC) and AngularJS to show the step–by–step implementation of the custom print functionality.
Some background
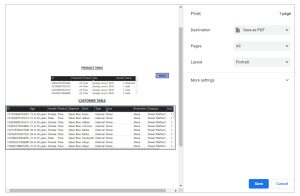
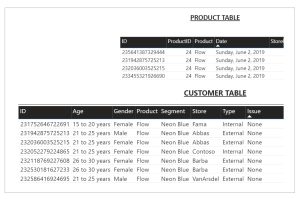
Normally, Power BI prints the entire visuals on the report. However, this is not applicable to the table visual. If we try to print the entire content of the Power BI table, the current Power-BI print functionality will print only the records that are visible on the screen—as shown in the screenshot below of the table visual. The records are present in the table visual but are not visible due to the preset height and width of the table, which are not included in the print.
In the case of reports that are embedded in an external web app (i.e., Power-BI embedded), we have developed a custom code using AngularJS and JavaScript to print the entire content of the Power-BI table visual.
Microsoft has provided a set of APIs to embed Power BI reports in an external web app. In this set of APIs, Microsoft has also provided a code block feature:
” Export visual data – summarized ” in their official webpage [1].
By using this API, we obtain the pointer to the table that needs to be printed. Once we get this pointer, we can iterate through each row in the table and copy it into an HTML table. This HTML table will be in-memory, created dynamically, and will be invisible to the end-users. Finally, we will pass this HTML table on for printing.
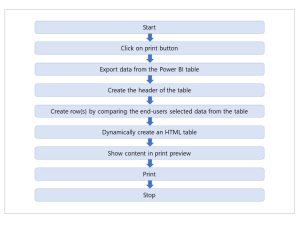
Here is a diagram which will walk you through the custom print logic:
There are 3 possible scenarios that need to be considered during the development of this code. They are:
- Print single table without “Total” row
- Print single table with “Total” row
- Print multiple tables on the same page
A quick overview of the code
Here’s a quick-and-dirty overview of the code.
- Write the common HTML code for all scenarios, as shown below:
<div id=“customtable3” style=”display:none;align-content: center;vertical-align: middle;” >
<div id=“customtable1” style=”align-content: center;align-self: center;justify-content: center; page-break-after: always;” > </div>
<div id=“customtable2” style=”align-content: center;align-self: center;justify-content: center; page-break-after: always;” > </div>
</div>
2. Get the visual IDsof the table(s) that needs to be printed
3. Check if a specific row(s) has been selected to print
Some important parameters : Following are the parameters that needs to be passed to the function that prints the table. Based on these parameter values the function identifies which table to print with total row.
- visual1: This is a first table visual ID/Name (an auto–generated, embedded, visual Name/ID).
- visual2: This is a second table visual ID/Name (an auto–generated, embedded, visual Name/ID).
- isSingleTable: This is Boolean. Type. ‘true’ if you want to print just the first table, or type ‘false’ if you want to print both of the tables.
- isTotalRowAdded: This is Boolean. Type ‘true’ if the total row added into the table and ‘false’ if the total row is not added into the table.
- selectedArray: This is an Array type, with stored, selected data from the first table or the second table.
Some important events in the print process: Following are the Power BI lifecycle events which need to be executed before called to the print function:
- On-loaded: This is when the Power BI report will be loaded for the first time in I-frame
- On-data-Selected: When a user selects any specific row(s) of the Power BI table
- On-button-Clicked: When a user clicks on any button in the Power BI report
By using the parameters and events listed above, all these 3 scenarios can be covered.
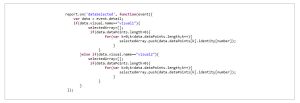
How to capture data from the table with end–user specific row(s) of the table
At this point, an “if- else” block is used to identify which table is selected by the user, and the identity [number] is used to identify the unique row of that table.
<insert short blurb about introducing the scenarios, what these scenarios are for, etc.>
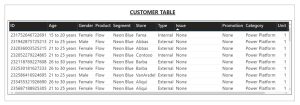
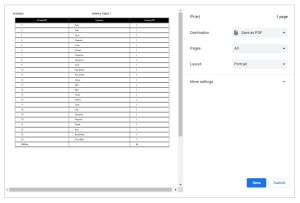
Scenario 1: Print a single table without the “Total” row
For this scenario, take a look at this single table, which has multiple rows and columns in it. Because of this, a horizontal and vertical scrollbar is visible.
Input table:
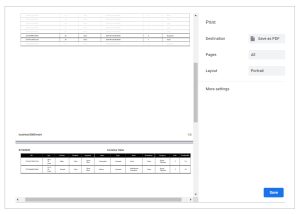
Here is the call print functionality:

Output table:
Scenario 2: Print a single table with the “Total” row.
For this scenario, consider a single table having the “Total” row present at the end. One of the limitations of Power Bi export is that it never exports the “Total” row. Because of this, we need to calculate this row manually and add it at the end of the table as shown below.
Input table:

This is what the call print functionality looks like:

Output:
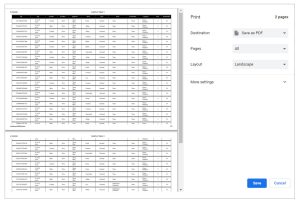
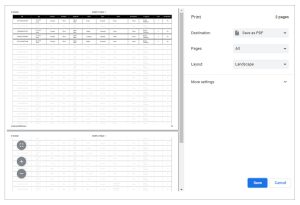
Scenario 3: Print multiple tables on the same page
For this scenario, consider if two tables are present on the same page of a report. These two tables interact with each other so that data will be filtered vice versa of the tables. As a result, both tables will print simultaneously when we pass two visuals to the function. Here, we programmatically added a page break after the new table, so that the next table will start on a new page of the print, as shown below,
Input table:
This is what the call print functionality looks like:

Output:
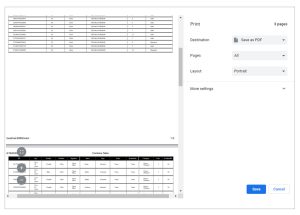
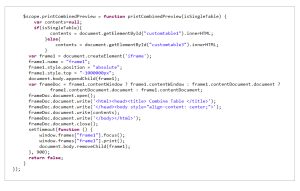
JavaScript print preview code
This is the final code that we pass to the printer so that document gets printed with all the records:
More resources on using the Power BI embedded playground code can be found here.
Have any questions about Power BI, custom printing, or other data visualization solutions? you can explore our data visualization services here for more resources, or talk to one of our BI experts.
