


By Umashankar Jedgule, Analytics team CloudMoyo
Power BI is enabling organizations to step into the future with advanced business intelligence tools. Teams within an organization can now access data from a myriad of sources, create reports with Power BI Desktop and share insights with each other through Power BI Service.
When you analyze data, create new reports or optimize existing ones in Power BI, here are some of the best practices to significantly improve your analysis and provide greater value from your data:
Relationships and modeling:
- Verify if the relationships that were auto-detected are correct.
- To improve the performance, remove unnecessary relationships and minimally use bi-directional relationships.
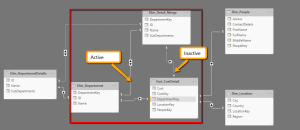
- Verify that inactive relationships are set up properly for model verification.
- When a pair of tables have more than one relationship (direct or indirect), there can be only one active relationship, rendering others as inactive. DAX function USERELATIONSHIP can be helpful to use a specific relationship out of all the available ones.
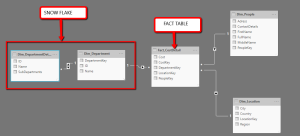
- Try reshaping data into fact dimension tables with a single key and one-to-many relationships from dimensions to fact. For better performance, consider building star schemas instead of Snowflake schema.
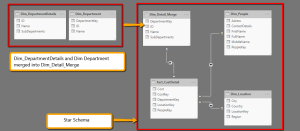
You can merge two dimensions, for example – Dim_Department and Dim_DepartmentDetails into one as Dim_Detail_Merge as shown in Figure 3, to avoid performance issues.
- If you have unused columns, consider removing them to save space, as space is one of the factors that impact the performance.
- Avoid pivoted data tables in Power BI, let’s walk step by step with this example:
Consider we have certain expenses related to advertising every month for 2019. To calculate the total advertising expenditure in 2019, we need to create 12 different measures (one for each month):
Advertising_Expenses_Jan = Calculate(Sum(‘Expenses’[1/1/2019]), ExpenseSubCategory = ‘Advertising’)
So on and so forth until
Advertising_Expenses_Dec = Calculate(Sum(‘Expenses’[12/1/2019]), ExpenseSubCategory = ‘Advertising’)
All such measures should be added to get the result:
Advertising_Expenses = Advertising_Expenses_Jan + Advertising_Expenses_Feb + ….
As you can imagine, this activity can become quite cumbersome. Additionally, even a single logic change can have drastic impact on the maintenance overheads so, such tables should be modeled row wise, as shown in figure 4:
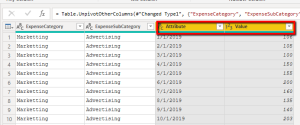
This way, a single measure can yield the required results:
Advertising_Expenses = Calculate(Sum(‘Expenses’[Value]), ‘Expenses’[ExpenseSubCatefory] = ‘Advertising’)
If you are thinking about the challenges with an increased number of rows in your analysis, consider Vertipaq Engine. It’s an in-memory columnar database engine that is optimized for quick vertical scanning. It can reduce the scanning time and memory required to store the data.
Mode of connection:
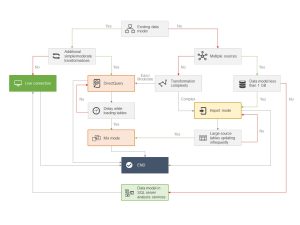
If you would like Power BI to send queries to the underlying data source in real-time, use live data connection or the DirectQuery mode. The Import mode can be used to refresh more regularly. Here are a few aspects to consider while choosing the mode of connection:
- Only import the columns that are needed.
- Source side enhancements – It’s also recommended to consume the data from ‘Database view’ instead of a table because views can have a clustered index assigned to temporarily store results that can speed up the queries.
- If the data model is huge in size, you can choose the live connection or DirectQuery mode. It allows you to build visualizations of very large datasets, which is otherwise not feasible to import with pre-aggregation.
Here’s a chart to help you choose the mode of connection:
Calculating column, measures, and DAX:
- Hide measures which are meant to support other DAX measures to avoid confusing the end-users while consuming the actual measures.
- Iterative functions like ‘SUMX’ visit every single row making the DAX performance slow, you might want to use ‘Calculate’ instead.
- Writing and debugging DAX calculations can prove to be challenging sometimes. Consider using variables while writing DAX, to avoid recalculating the same patterns, improve performance, simplify debugging, improve readability, and reducing complexity.
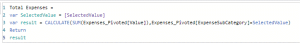
- For example, in figure 5 ‘SelectedValue’ is dynamic in nature, it is generated by another measure. This value can be stored in a variable and used for multiple calculations instead of calculating it every time. The scope of a variable is limited to the measure in which it is created.
- Sometimes errors occur when you open datasets in Power Query, and the Power Query Editor might not catch them. You can ‘remove errors’ from the table loading into Power BI or move them to an ‘Exception table’ and choose ‘Keep errors’. This table will only keep rows that cause errors. Error handling helps users as well as developers to understand the health of a report. It also makes debugging easier.
- It’s recommended to use the DIVIDE function instead of Column A/Column B, as the DIVIDE is better optimized for performance gain.
- If your integer column consists of null, consider using ISNULL DAX function for better performance.
- Any non-hidden numeric columns that are not intended to roll-up or summarize values should be set to ‘Do Not Summarize’ in the modeling ribbon in Power BI Desktop. Columns set to summarize are indicated with a Sigma icon.
Report and dashboard best practices:
To gain better performance, you can remove the default interactions added to every visualization, avoid using the hierarchical filters, and add dashboard as a landing page (since dashboard tiles are served by query cache). Consider limiting the number of visuals in dashboards and reports to not more than 10, as it slows down the report. It might be a good choice to use Microsoft AppSource certified custom visuals as they have a robust and well-performing code.
There is information in every report which is specifically relevant to report owners and developers like data source information, useful measures, and consumed table list. It can be placed either at the beginning or end of the report and be hidden from other users.
Gateway best practices:
Consider using different gateways for DirectQuery (live connection) and scheduled data refresh because using the same gateway will slow down the performance of a live connection if scheduled data refresh is active.
If the gateway is becoming a bottleneck, you might want to scale up (moving the gateway to a more powerful machine with more CPU cores and increased RAM) or scale-out (for example, splitting out datasets onto different gateways). The recommended hardware specification for Power BI gateway is 8 CPU cores and 16-GB RAM.
Network latency between the server and azure region can sometimes be a contributing factor to slow performance. You can use Azure Speed Test 2.0 for measuring the network latency in Microsoft Azure Data Centers.
Naming convention best practice:
To avoid confusion between similar files, try intuitive names. In Power BI Services, dashboards or reports by default show only the first 20 characters. Though you can hover over it to see the full name of the file, it might just be better to fit your report name within 20 characters.
Separating datasets and reports into multiple files:
Each file splits into two when it is published to Power BI Services – ‘Power BI report’ and ‘Power BI dataset’. If you have multiple reports pointing to the same data model, it will lead to unnecessary datasets in Power BI. It can be avoided by using the existing Power BI dataset to build a new report.
Disaster recovery and version maintenance:
Presently, Power BI doesn’t provide complete version control like Azure DevOps, but there are a few simple tricks that can be used to streamline Power BI version control. Power BI Templates (PBIT) is a great tool to make backups and for version archiving purposes. PBIT is kind of a metadata file for your PBIX which doesn’t contain data.
To maintain a dataset version history, you can create an internal table using ‘Enter data’ with version number, timestamp, and developer information. This way you don’t have to rely on external sources to maintain the version history information. Additionally, it’s always good to perform a ‘Last refresh’ on your model by adding a custom column to any table of your model, preferably a table with fewer rows.
Consider creating the following measures for the report developers, so they can easily access the version history:
- Measure name = Definition
- Last refresh date/time = MAX( ‘VersionHistory'[Update Timestamp] )
- Current version = MAX( ‘VersionHistory'[Version Number] )
Wrapping up
Power BI allows you to access, analyze, and visualize large, complex datasets with ease enabling a seamless experience. You can identify trends and visualize insights from your data which are otherwise not explicit. With plenty of advanced features at its disposal, Power BI is one of the most powerful business intelligence tools. Implementing Power BI best practices can put you an extra mile ahead of your competitors.
